



Ethereum (ETH) is up more than 10% over the last seven days as the market shows signs of renewed activity. However, key technical indicators reveal a mix of weakening trend strength and cautious optimism from buyers.
ETH is currently battling critical resistance zones that could define whether the rally continues or fades. With momentum still fragile, May could be a decisive month for Ethereum’s next major move.
Ethereum’s Trend Weakens Sharply as Bears Close In
Ethereum’s DMI chart shows its ADX is currently at 24.91, a sharp decline from 39 two days ago. The ADX, or Average Directional Index, measures the strength of a trend, whether up or down.
Generally, an ADX reading above 25 signals a strong trend, while values below 20 suggest the market is entering a period of weakness or range-bound trading.

The steep drop in ADX indicates that Ethereum’s recent momentum is quickly losing strength. Without renewed buying or selling pressure, ETH could remain stuck in a more volatile, sideways pattern over the short term.
Meanwhile, the directional indicators are showing a clear shift. The +DI, which tracks bullish pressure, has dropped to 22.71, falling from 31.71 three days ago and 27.3 yesterday.
In contrast, the -DI tracks bearish pressure has climbed to 17.68, up from just 7.16 three days ago and 15.64 yesterday. Yesterday, the gap between buyers and sellers nearly closed, with +DI at 20.91 and -DI at 20.1, suggesting sellers almost regained market control.
This rising bearish momentum and a weakening trend strength raise the risk of Ethereum’s price slipping lower if buyers cannot defend key levels. However, if bulls manage to hold ground and reclaim momentum, ETH could still mount another attempt at recovery.
ETH RSI Climbs After Sharp Drop: Will the Recovery Hold?
Ethereum’s RSI is currently sitting at 56, up from 45.5 one day ago, after reaching 70.46 four days ago. The Relative Strength Index (RSI) is a momentum indicator that measures the speed and magnitude of price movements.
Typically, an RSI above 70 suggests an asset is overbought and may be due for a pullback, while an RSI below 30 indicates oversold conditions and the potential for a rebound.
Readings between 30 and 70 are considered neutral, with levels around 50 often signaling a market at a decision point. The sharp swing in Ethereum’s RSI over the past few days reflects the recent volatile sentiment around ETH.
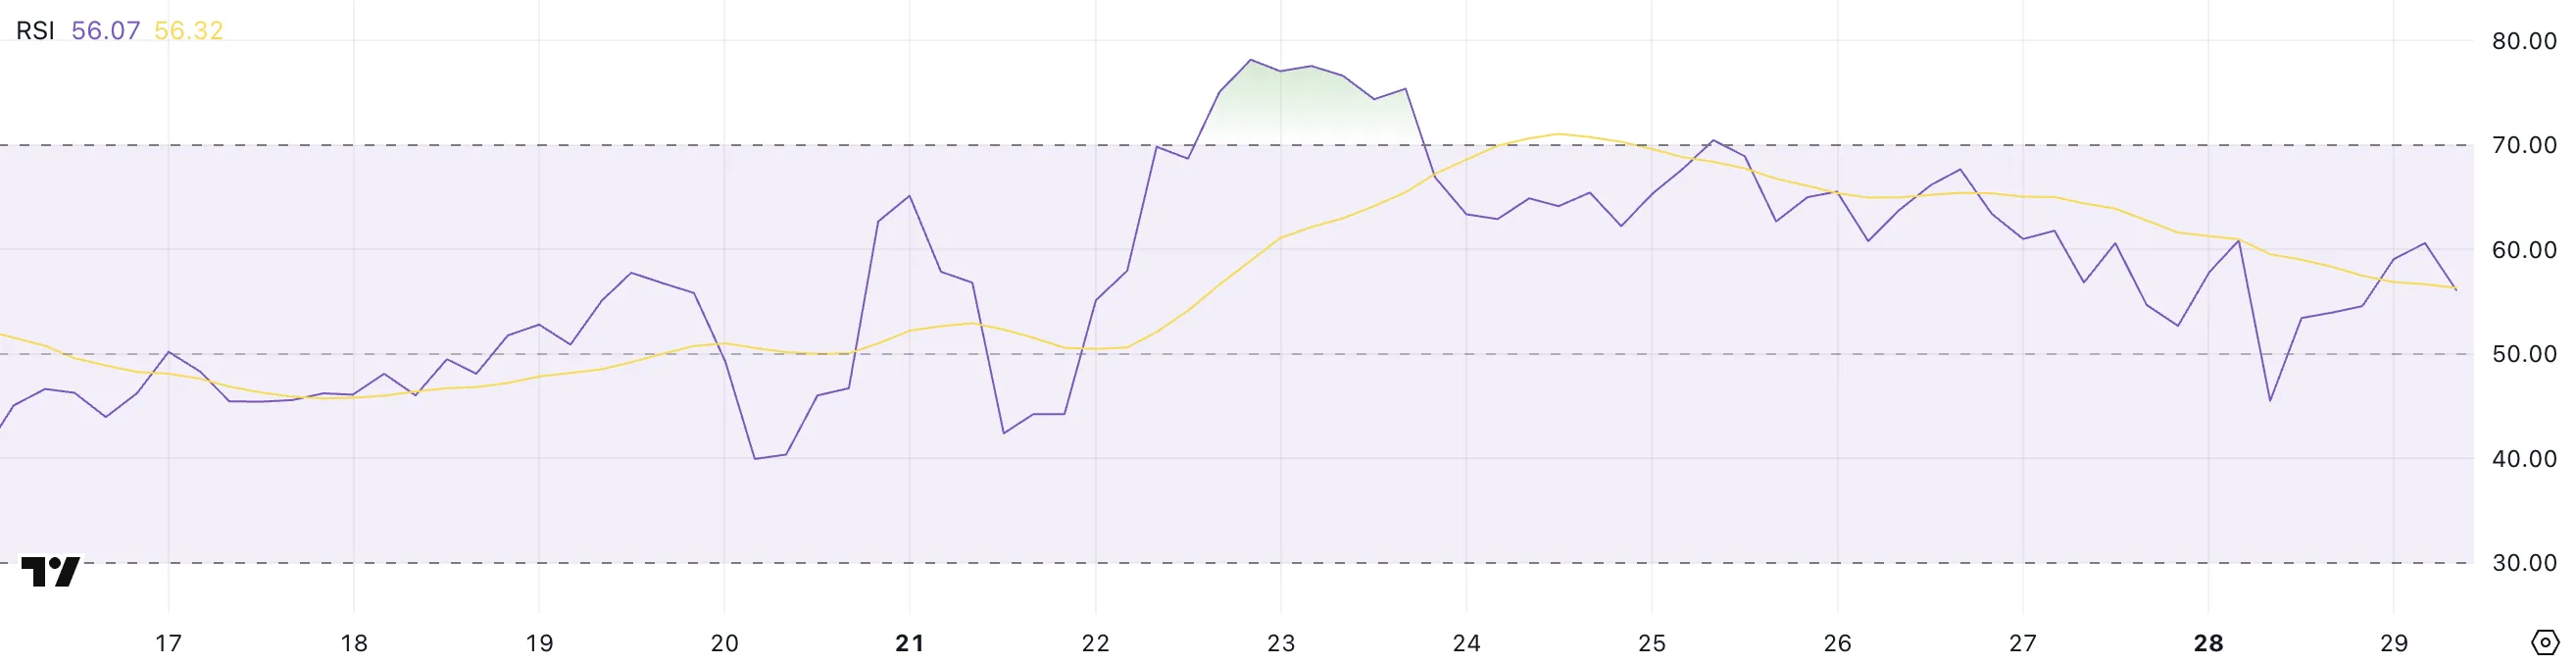
With the RSI back up to 56, Ethereum has regained momentum after dipping into neutral-to-bearish territory. A reading above 50 leans slightly bullish, suggesting that buyers have started to reassert some control, though not with overwhelming strength.
If the RSI continues to climb toward 60 and beyond, it could signal a renewed push higher for ETH prices.
However, if momentum stalls again and the RSI turns back down, it would suggest the recovery is losing steam and that Ethereum could fall back into a broader consolidation or even a correction phase.
Ethereum Battles Key Resistance as Breakout or Breakdown Looms
Ethereum price has made several attempts over the past few days to break above the resistance level at $1,828. If ETH manages to break and hold above this level decisively, it could open the door for a stronger move upward.
The next major target would be $1,954, and if bullish momentum remains strong, a further rally toward $2,104 could unfold. Ethereum could eventually test $2,320 in an even more aggressive uptrend, marking a significant bullish extension.
These levels will be key to watch as they could define the strength and sustainability of any breakout in the coming days.
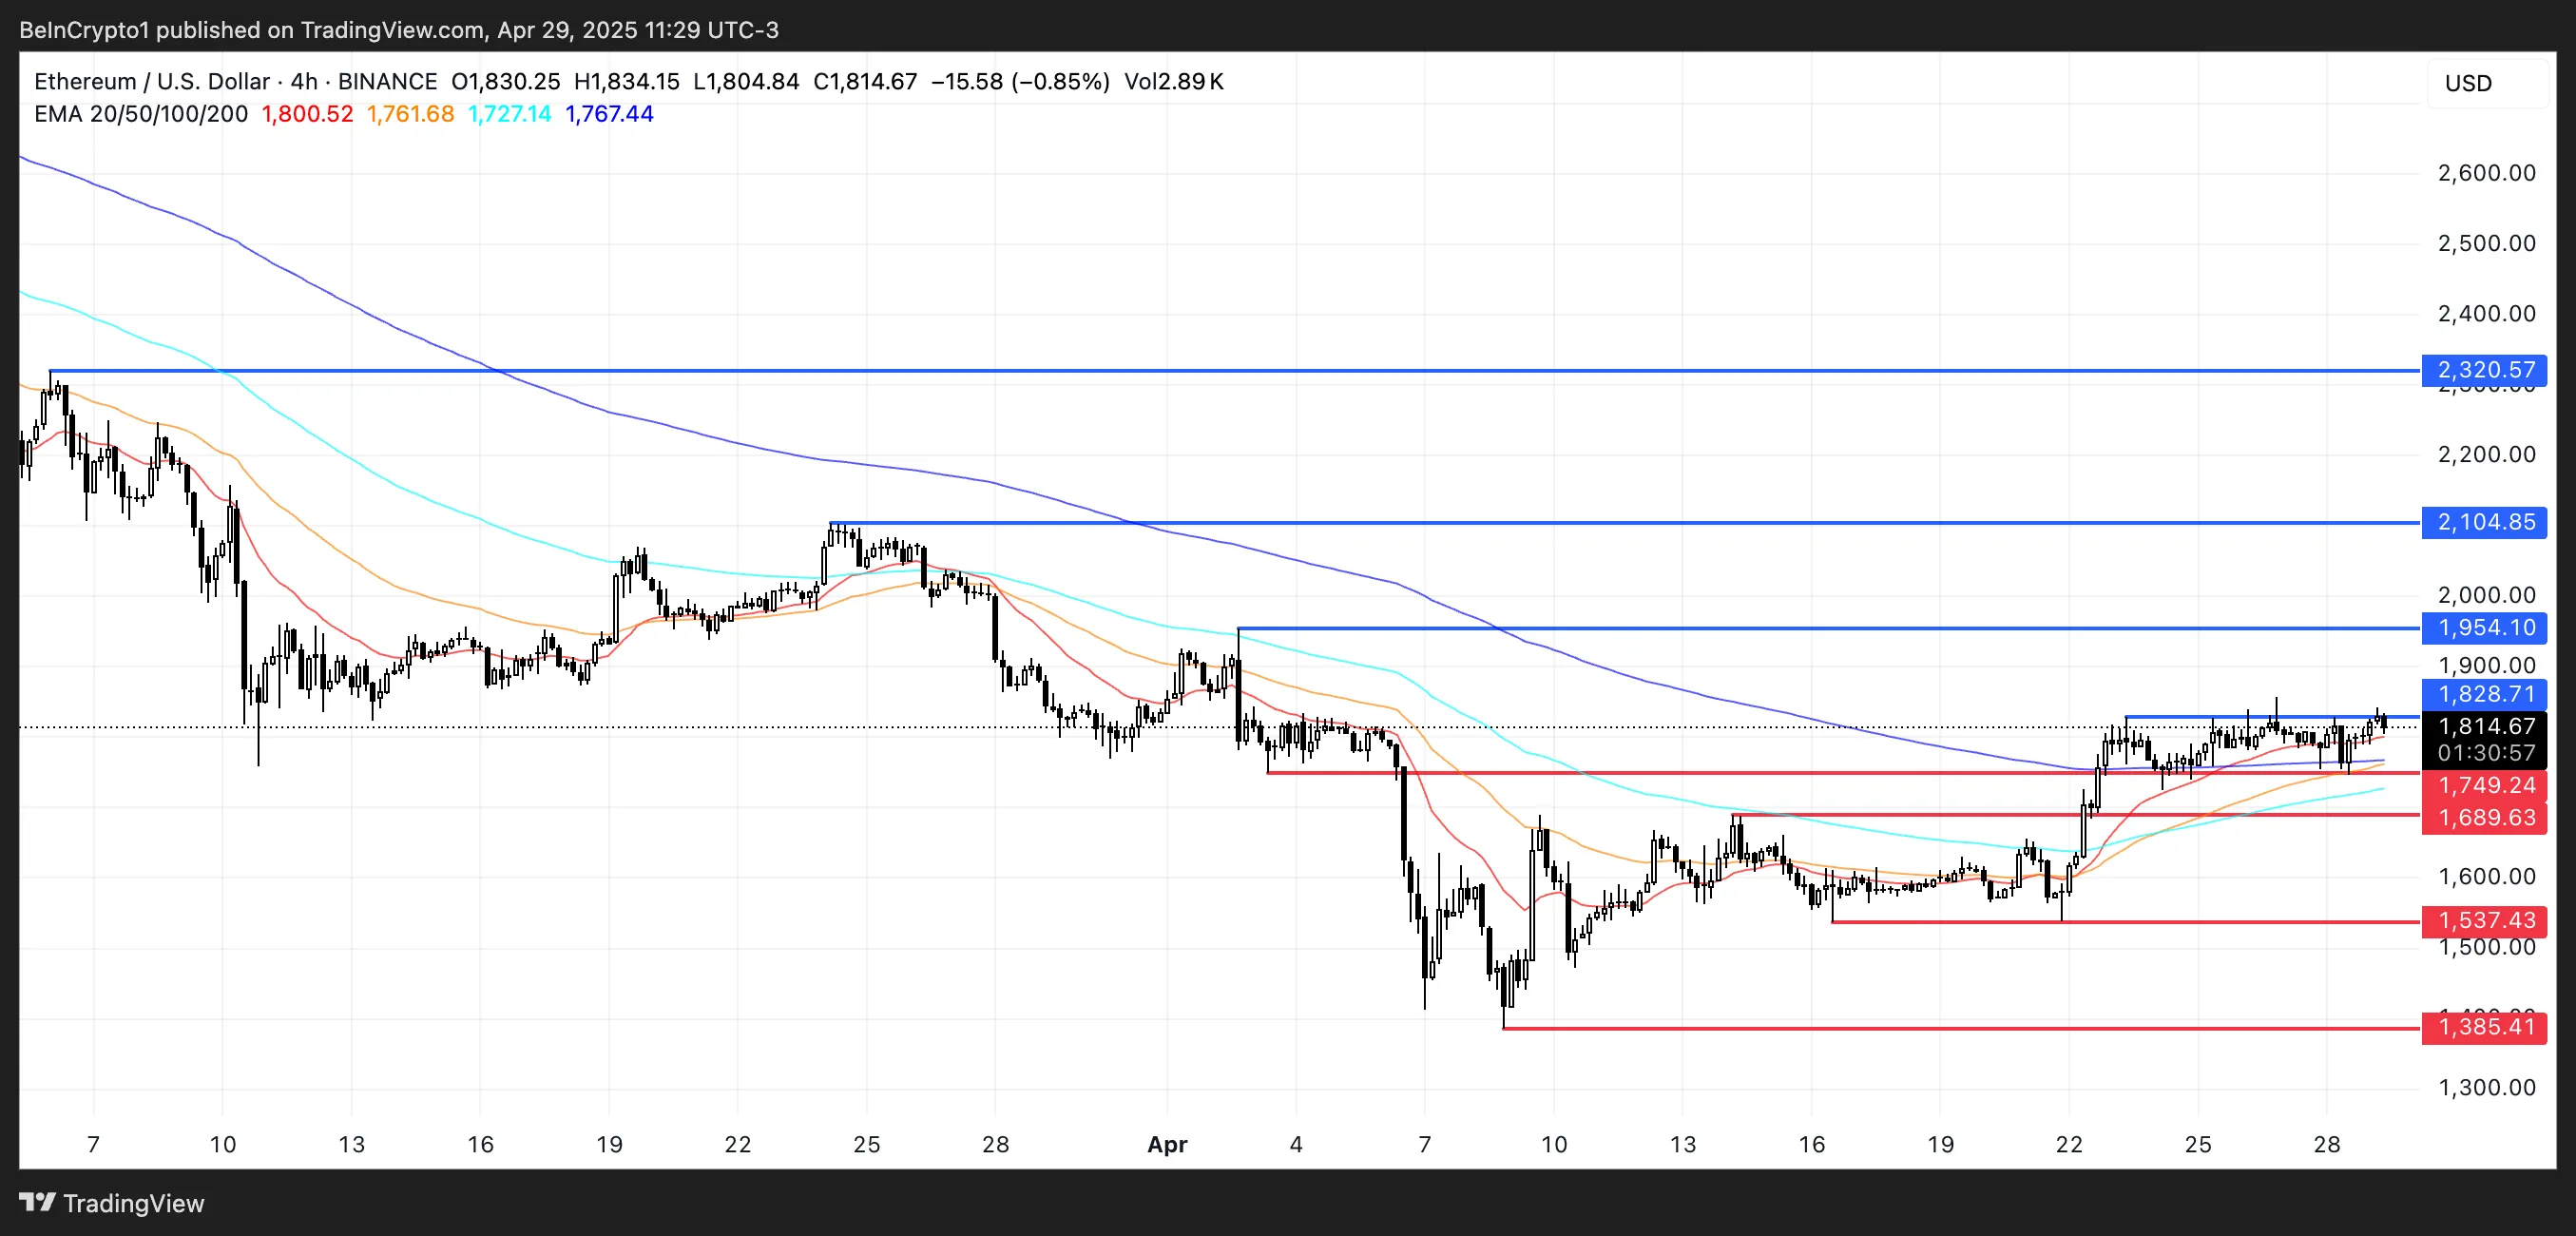
On the downside, if Ethereum fails to hold its current levels and the trend reverses, the first critical support to watch lies at $1,749. A break below that could trigger a move lower toward $1,689.
If selling pressure intensifies, ETH could extend the downtrend even further, with major support levels at $1,537 and $1,385 coming into play.
Losing these levels would signal a much deeper correction, suggesting that the recent attempts at recovery were only temporary before a more prolonged bearish phase sets in.
Disclaimer
In line with the Trust Project guidelines, this price analysis article is for informational purposes only and should not be considered financial or investment advice. BeInCrypto is committed to accurate, unbiased reporting, but market conditions are subject to change without notice. Always conduct your own research and consult with a professional before making any financial decisions. Please note that our Terms and Conditions, Privacy Policy, and Disclaimers have been updated.



