



Tron (TRX) price is showing mixed signals, leaving traders uncertain about its next move. Recent indicators suggest a balance between bullish and bearish forces, with no clear direction emerging yet.
With its market position closely tied to next movements, TRX could either push higher or face a potential decline.
TRX Aroon Indicator Shows Mixed Signals
The Aroon indicator for Tron currently shows an Aroon Up value of 64.29% and an Aroon Down value of 7.14%. These numbers suggest that TRX has experienced recent highs, but the upward trend is not particularly strong, while the lack of recent lows points to minimal bearish pressure.
The Aroon indicator is a tool used to gauge the strength of a trend by measuring the time between highs (Aroon Up) and lows (Aroon Down) over a specific period. When the Aroon Up is above 70%, it signals a strong uptrend. On the other hand, an Aroon Down above 70% suggests a strong downtrend.

Conversely, values below 30% indicate a weakening of the respective trend. In TRX’s case, the current Aroon values signal a somewhat positive momentum but not a dominant uptrend.
Read More: TRON (TRX) Price Prediction 2024/2025/2030
Moreover, the Aroon’s frequent oscillation between high and low values reflects an inconsistent trend, where TRX has been switching between upward and downward movements without a clear direction.
This rapid shift between Aroon Up and Aroon Down highlights indecision in the market. Neither buyers nor sellers have maintained control for an extended period.
Tron RSI Is Close to the Overbought Stage
TRX’s current RSI is 61.45, indicating that while it is above the midpoint of 50, it is not yet in overbought territory, which typically starts at 70.
The Relative Strength Index (RSI) is a momentum oscillator that measures the speed and change of price movements. It ranges from 0 to 100 and helps traders identify overbought or oversold conditions in an asset. When the RSI climbs above 70, it signals that the asset may be overbought. This often leads to a potential price pullback or correction.
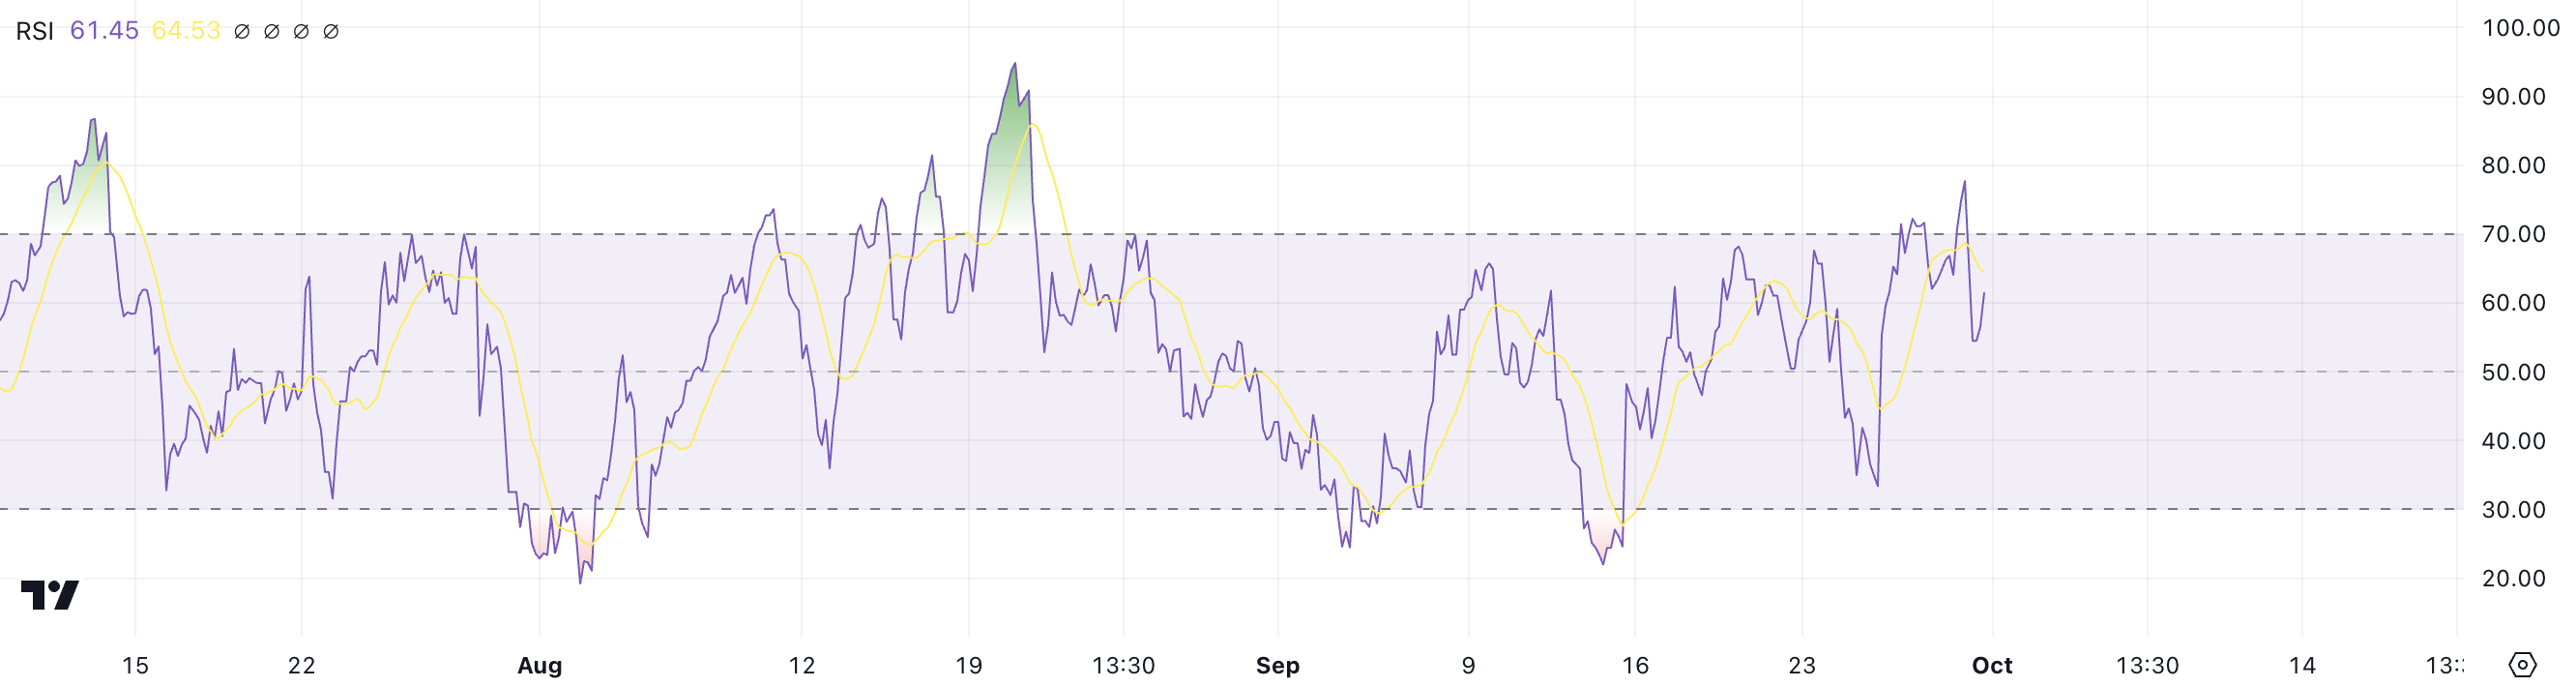
While TRX’s RSI is not yet in the overbought range, the sideways movement in price suggests indecision in the market. If the RSI continues to rise and hits the overbought threshold, it could trigger a correction.
This scenario makes it crucial to monitor TRX closely for any signs of upward pressure pushing the RSI toward 70, as such a move could spark a near-term price drop.
TRX Price Prediction: Could Cardano Surpass Tron?
The market cap difference between Cardano (ADA) and Tron (TRX) stands at $280 million, with TRX showing signs of losing momentum after the initial excitement brought on by SunPump. Although the EMAs for TRX still signal a bullish sentiment, the narrow gap between them reveals that the strength of this uptrend may not be as strong as it initially appeared.

EMA lines, or Exponential Moving Averages, are key tools in technical analysis. They are designed to smooth price fluctuations and assign greater importance to more recent price action. When shorter-term EMAs remain above longer-term ones, it typically suggests that the asset is in a bullish trend, reflecting sustained upward momentum.
However, when the distance between these lines is minimal, as is the case with TRX, the strength of the trend is called into question. That signals that it may not be powerful enough to sustain further significant upward moves.
Should the uptrend continue, TRX could push toward the next resistance levels at $0.1617 and $0.17, representing a potential gain of approximately 10% from current levels. These price points are critical because breaking through them could attract more buying interest and validate the bullish outlook.
Read more: 7 Best Tron Wallets for Storing TRX
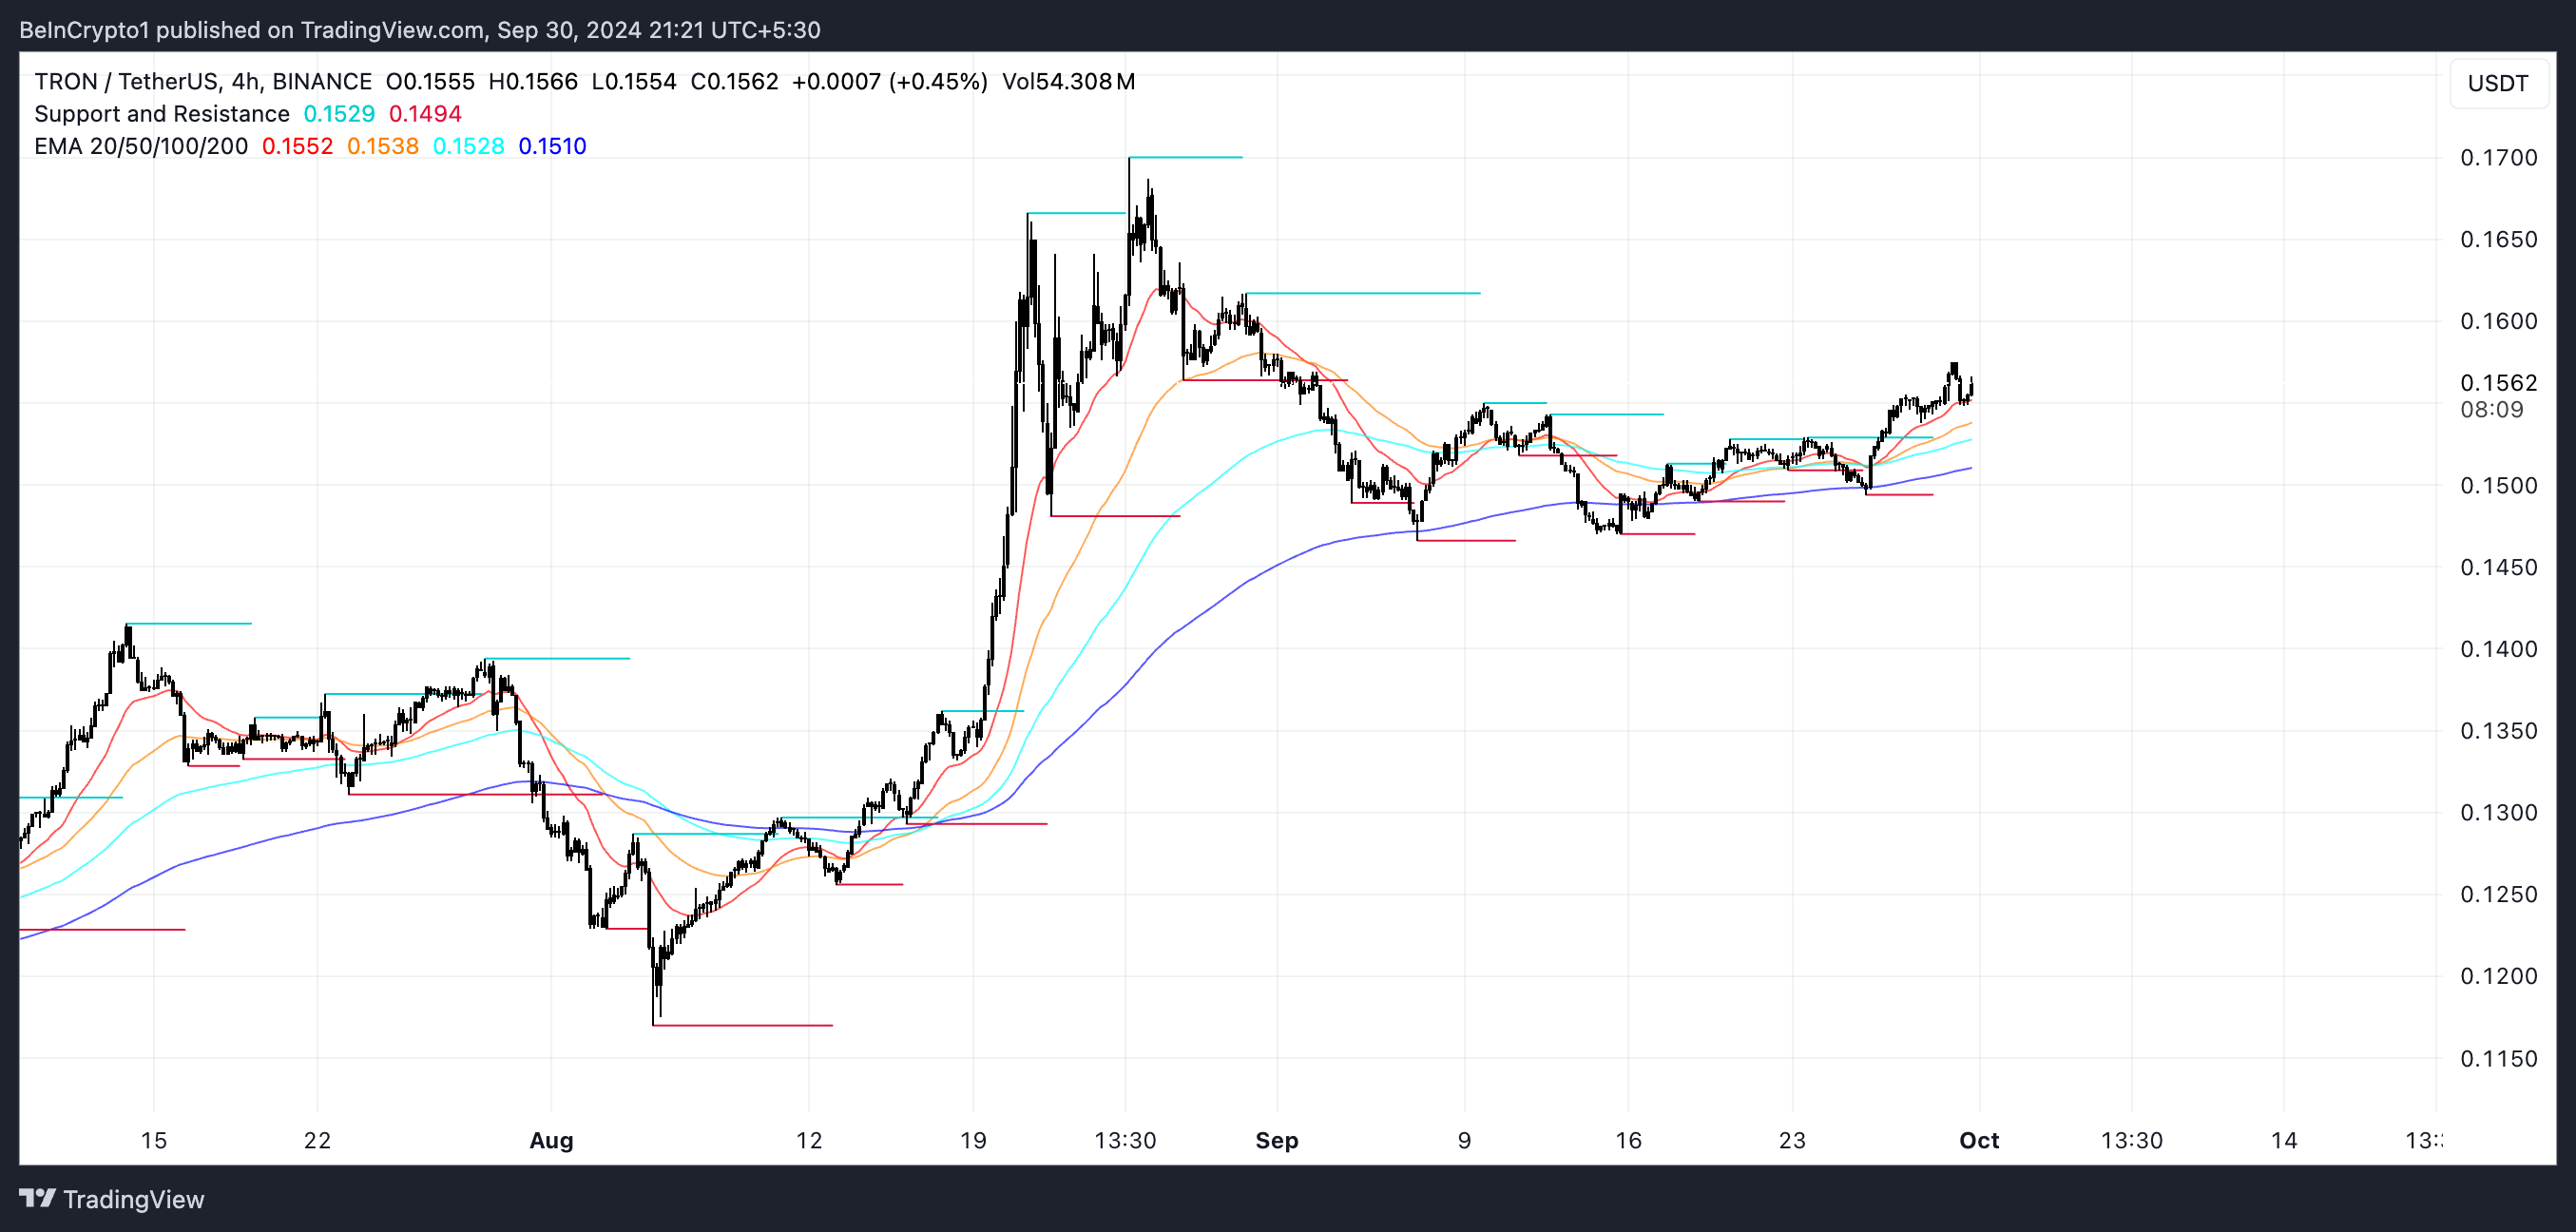
That can be triggered by news like Justin Sun announcing new features, such as a Tron-based NFT platform. However, the narrow EMA gap raises the risk that the trend may lose momentum, and if this happens, TRX might face a reversal. In such a case, the asset could experience a downturn, with potential support levels around $0.1295 and $0.1170.
A drop to these levels would be significant, as it would jeopardize TRX’s standing among the top 10 coins by market capitalization. In such a scenario, ADA could surpass TRX.
Disclaimer
In line with the Trust Project guidelines, this price analysis article is for informational purposes only and should not be considered financial or investment advice. BeInCrypto is committed to accurate, unbiased reporting, but market conditions are subject to change without notice. Always conduct your own research and consult with a professional before making any financial decisions. Please note that our Terms and Conditions, Privacy Policy, and Disclaimers have been updated.