



Movement Network (MOVE) has been gaining attention after announcing a $38 million buyback in response to improper activity by a Binance market maker. Despite the corrective phase that followed its sharp price spike, MOVE is still up over 13% in the last seven days.
Key indicators like RSI and DMI suggest that bullish momentum is cooling off. However, depending on market sentiment, a new trend could still develop.
Is MOVE Overbought in the Market?
MOVE’s Relative Strength Index (RSI) is currently at 56, down significantly from 83 just two days ago when its price experienced a sharp spike. That happened after the company behind it announced a $38 million buyback after discovering improper activity by a Binance market maker.
The RSI is a momentum oscillator that measures the speed and magnitude of price movements on a scale from 0 to 100.
Readings above 70 indicate overbought conditions that could lead to a pullback. Readings below 30 suggest oversold conditions that may precede a bounce. Values between 30 and 70 are considered neutral, with 50 acting as the midpoint.
Prior to its recent surge, MOVE’s RSI hovered in the neutral zone for 23 consecutive days. That reflects a period of low momentum and price stability.
The sudden spike that pushed RSI into overbought territory was followed by this pullback to 56. That signals that the extreme bullish momentum is cooling off.
While 56 remains in neutral territory, it still leans slightly bullish and suggests that the altcoin may be consolidating before its next move. If buying interest returns, the current RSI level gives it room to push higher without being technically overbought.
Movement DMI Shows Buyers Could Lose Control In The Next Days
MOVE’s DMI chart shows that its Average Directional Index (ADX) is currently at 32.97, holding steady since yesterday after surging from just 9.74 two days ago.
The ADX is a key indicator used to measure the strength of a trend on a scale from 0 to 100. Readings below 20 suggest a weak or nonexistent trend. Values between 20 and 25 hint at a trend starting to form, and anything above 25 confirms a strong trend.
With MOVE’s ADX now firmly above 30, it signals that the recent price movement has established a solid trend.
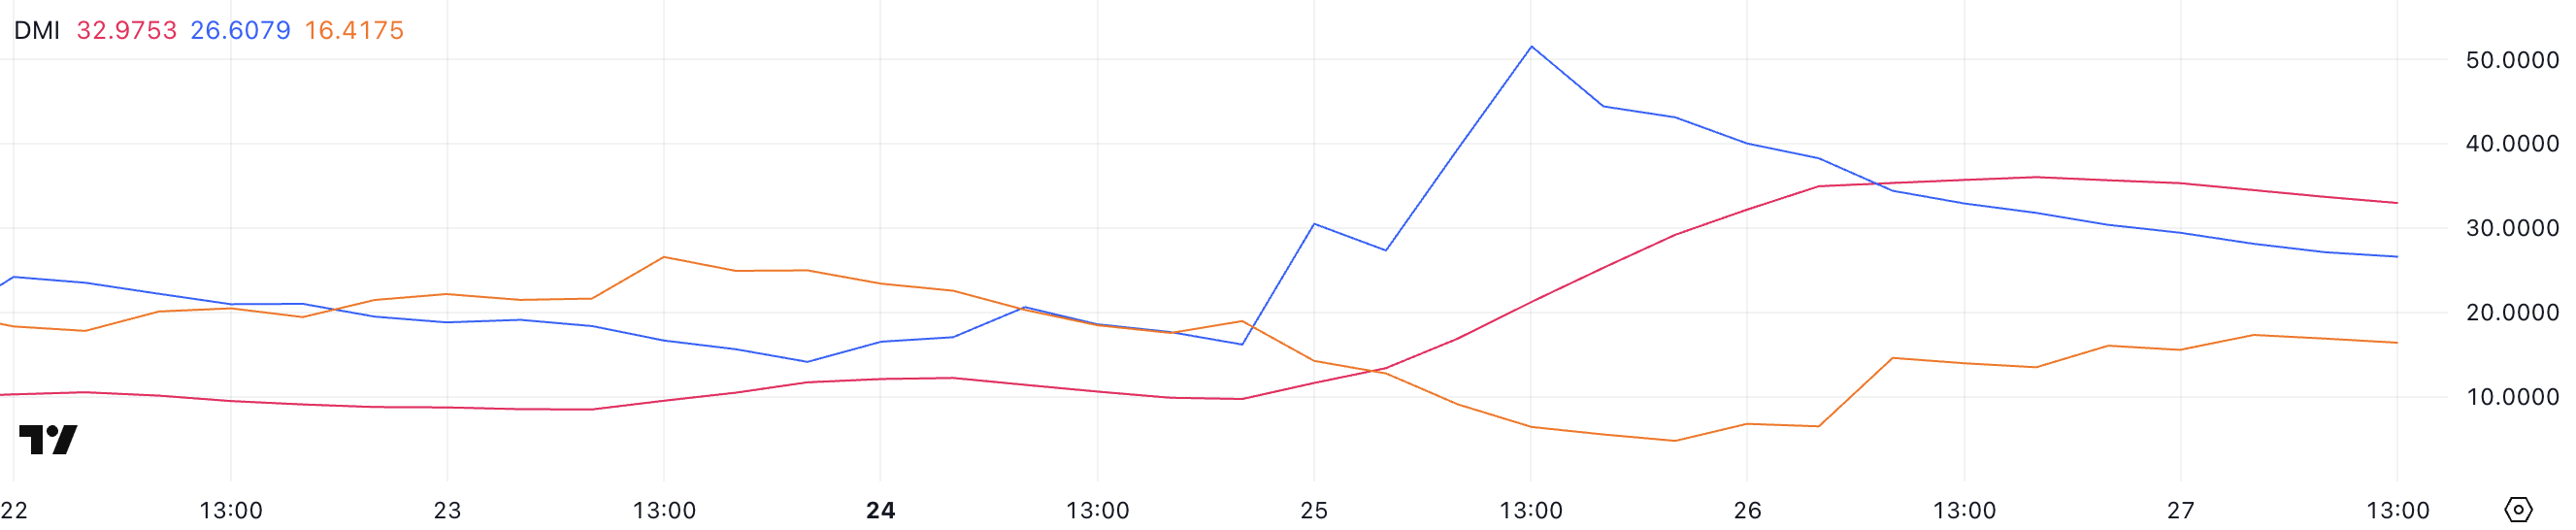
Alongside the ADX, the +DI (Positive Directional Indicator) and -DI (Negative Directional Indicator) offer insight into the direction of that trend.
Currently, +DI is at 26.6, falling from 51 two days ago. On the other hand, -DI has climbed to 16.41 from 6.43 in the same period.
This indicates that bullish momentum has cooled off after the recent surge, while bearish pressure is gradually increasing. Despite the strong trend strength indicated by the ADX, the shrinking gap between +DI and -DI suggests that the bullish momentum is fading. That means the trend may be weakening or transitioning.
Based on these indicators, MOVE could now enter a period of consolidation or face a pullback unless new buying pressure emerges.
Will MOVE Drop Below $0.40 In April?
Following its sharp 30% price surge on March 25, which made it one of the best-performing altcoins of that day, MOVE has entered a corrective phase. The altcoin is now trading 11% below its recent peak.
This kind of pullback is not uncommon after such an aggressive move, as traders take profits and momentum cools off. The ongoing correction focuses on several key support levels—$0.479 is the first.
If that level fails to hold, MOVE could decline further toward $0.433 and $0.409. Also, a deeper drop toward $0.37 is possible if bearish momentum extends into April.
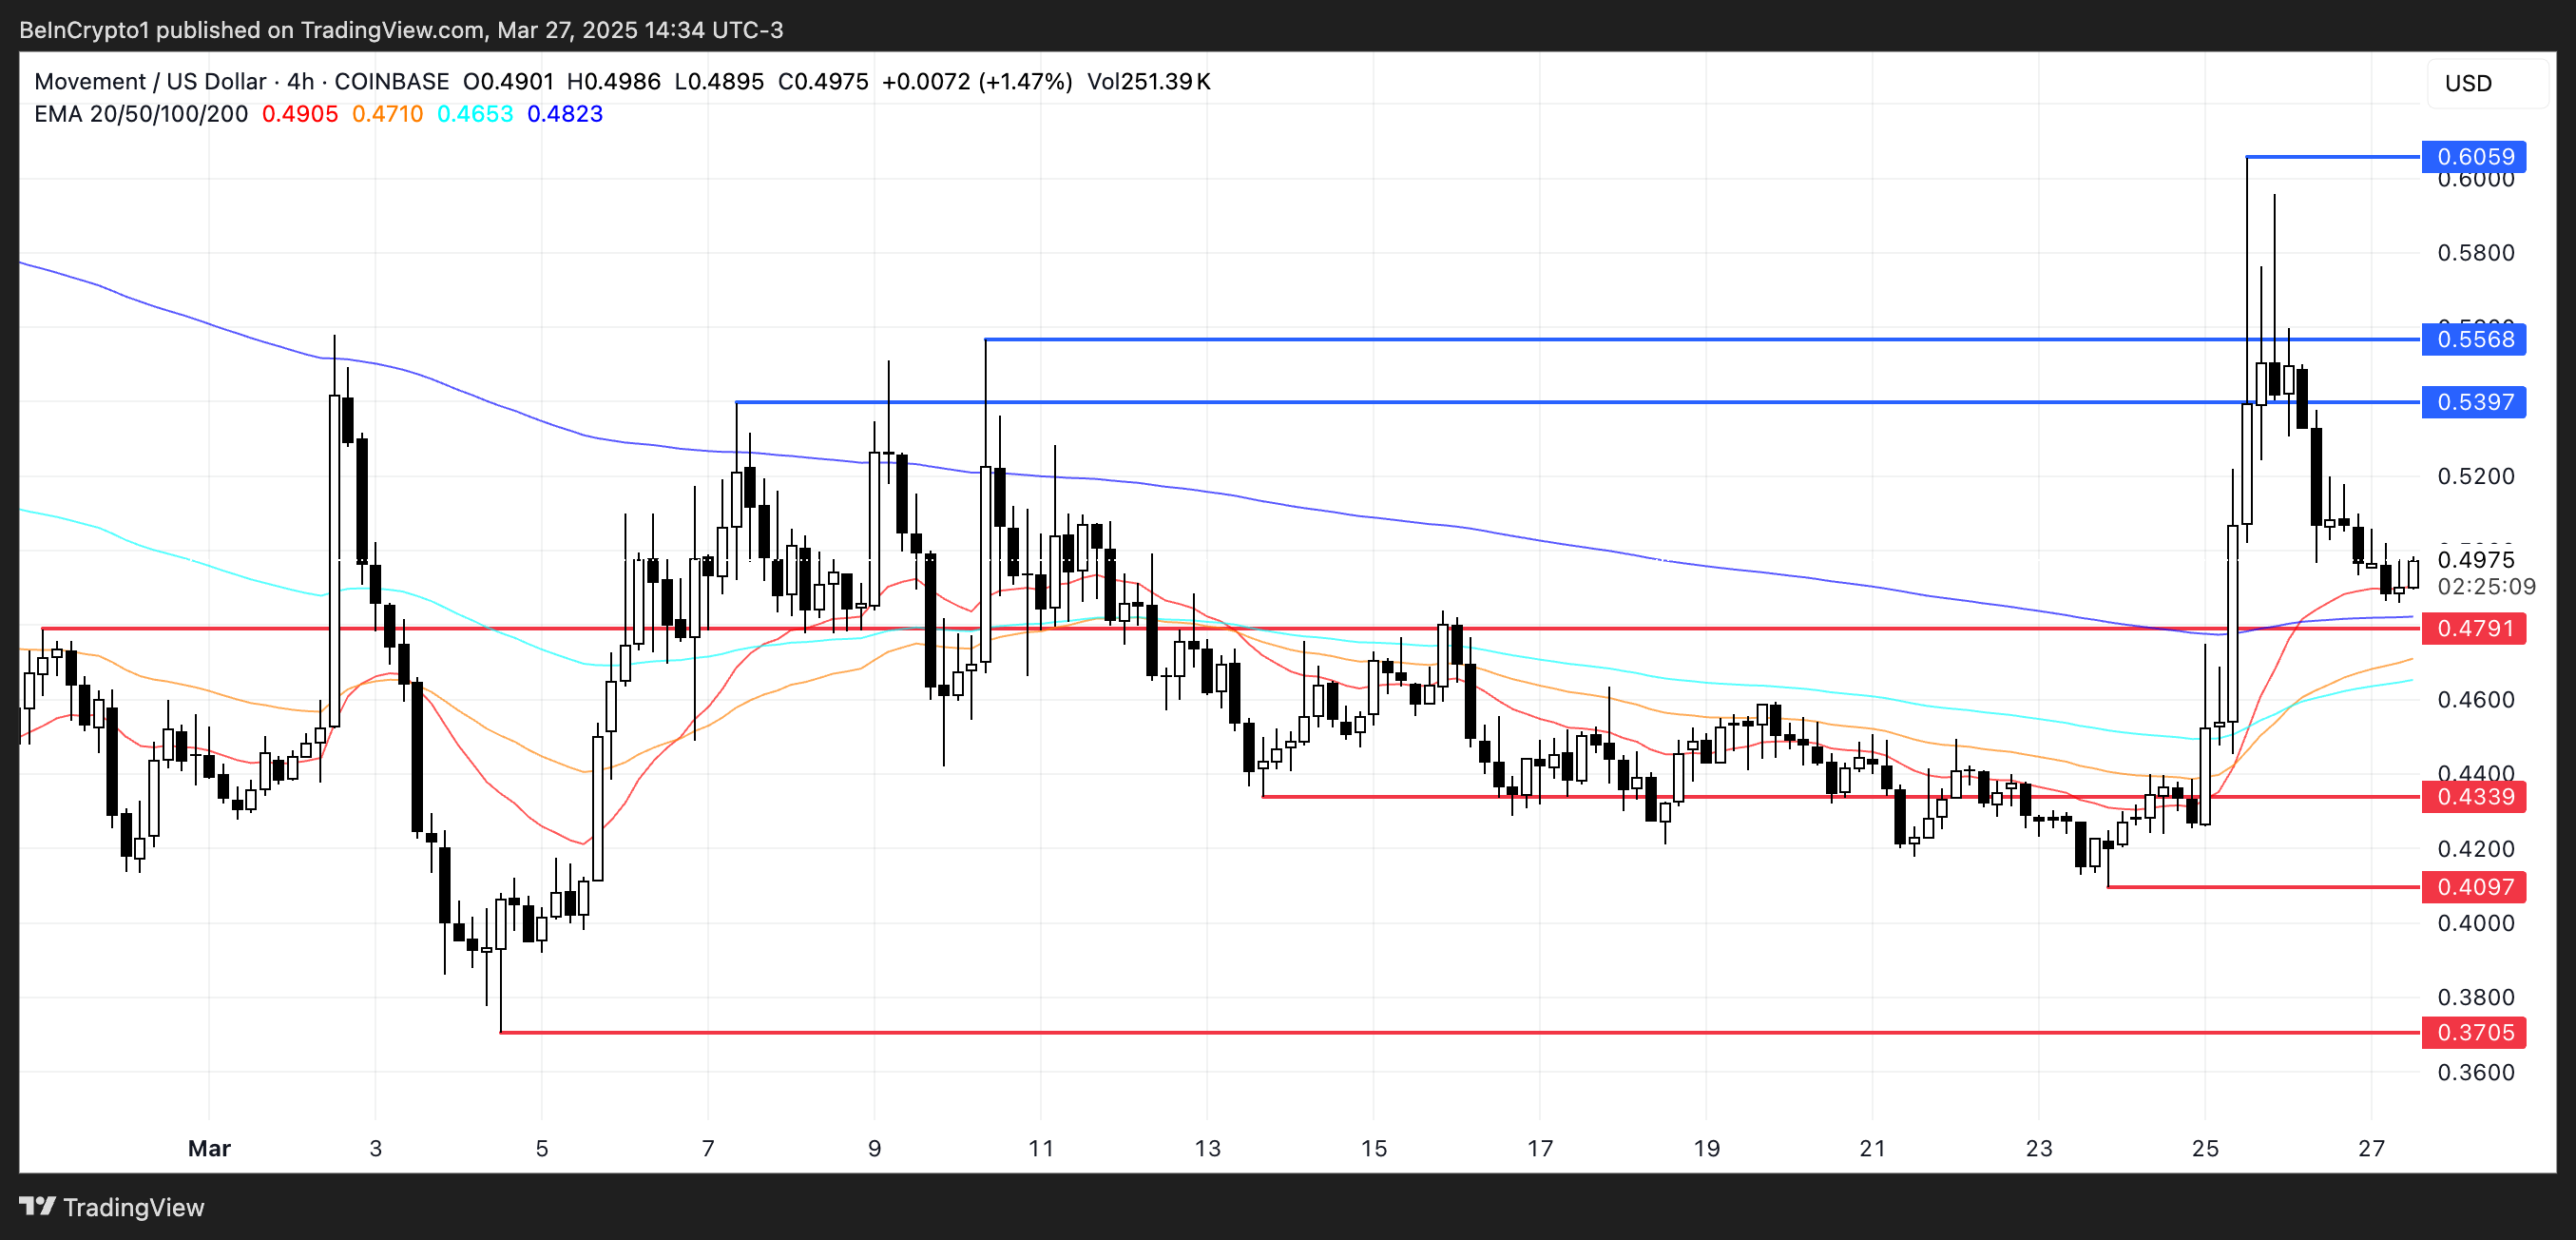
However, if sentiment around the MOVE ecosystem improves and confidence returns, the current pullback could be short-lived.
A rebound could see MOVE retest the resistance at $0.539. A successful breakout above that could open the path to $0.55, which wasn’t broken yesterday, and even $0.60.
Disclaimer
In line with the Trust Project guidelines, this price analysis article is for informational purposes only and should not be considered financial or investment advice. BeInCrypto is committed to accurate, unbiased reporting, but market conditions are subject to change without notice. Always conduct your own research and consult with a professional before making any financial decisions. Please note that our Terms and Conditions, Privacy Policy, and Disclaimers have been updated.