



NEAR is currently trading at just 17% below its local high of $9, which was reached in mid-March.
The price has rebounded impressively by 72% from the local low experienced in mid-April, demonstrating strong price action and a potential trajectory toward reclaiming the $9 mark.
NEAR: Technical Chart Analysis
This analysis will highlight the current support and resistance levels and explore the implications of transactional data trends for Near Protocol’s price movements.
On the daily chart, NEAR is positioned above both the 100 EMA (blue) and the 200 EMA (green). The 100 EMA sits at $6.54, while the 200 EMA is at $5.32, and they provide strong support levels.
The Ichimoku Cloud on the daily chart acts as a support zone. The price has stayed above the cloud, signaling that the overall trend remains upward.
Read More: What Is NEAR Protocol (NEAR)?
The cloud serves as a dynamic support area, reinforcing the support offered by the EMAs. The bullish outlook is supported as long as the price remains above the cloud and these EMAs.
The price falling below the Ichimoku Cloud could indicate a potential price reversal. Exercise caution in such a bearish scenario.
The 4-hour chart offers a slightly different perspective for the short to mid-term.
This time, the Ichimoku Cloud is acting as resistance. The price is currently testing the lower boundary of the cloud, suggesting some selling pressure at this level. The 100 EMA on the 4-hour chart is $7.50, while the 200 EMA is $7.41. The price hovers around these levels, indicating a potential standoff between buyers and sellers.
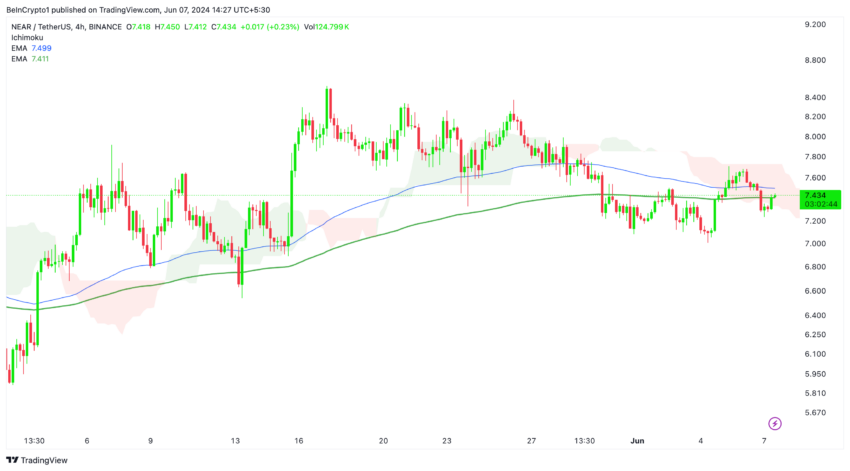
The price needs to break above the 4-hour Ichimoku Cloud decisively for continued upward movement. A successful breakout would indicate a shift in momentum back to the bulls, with resistance levels from the daily chart as the next targets.
However, if the price fails to move above the cloud, it may lead to a period of consolidation or a pullback to the current resistance levels indicated by the 100 and 200 EMAs.
Daily Transaction Volume Decrease on the Near Protocol
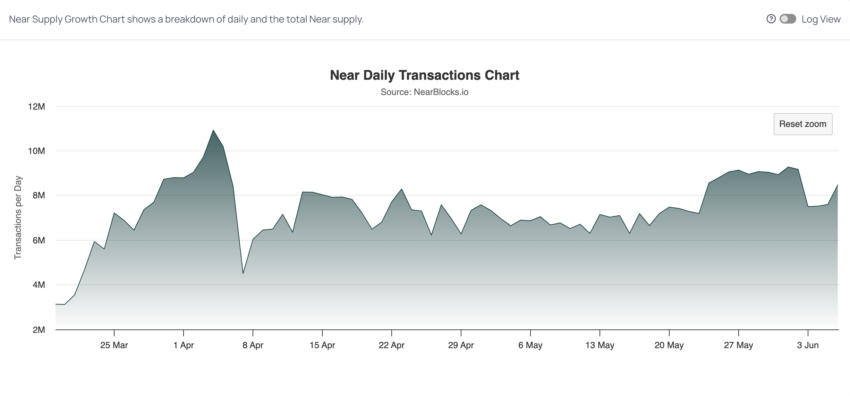
Near’s daily transactions have been experiencing important volatility, with significant drops observed in early April and late May.
During May, daily transactions stabilized at around 6 million. Notably, in late May, there was a significant drop from 9 million to 7 million, but transactions have since rebounded to 8 million. If this metric continues to rise to 10 million daily transactions, it could indicate a highly bullish trend for Near.
On the other side, Near Protocol’s daily transaction volume has experienced a considerable decline.
Important peaks were observed on May 31 and June 3, both reaching $300 million. However, since the peak on June 3, the transaction volume has dropped significantly to $60 million.
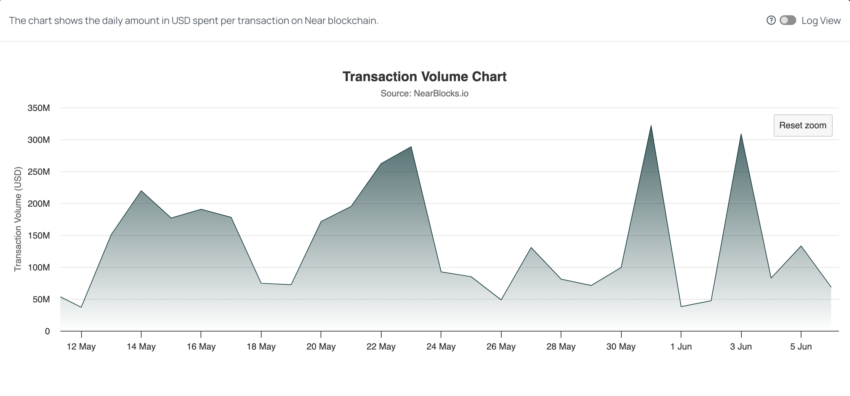
These transaction spikes can indicate rising transactional trends on the Near Protocol, signaling heightened activity and user engagement.
For instance, the peak on June 3rd anticipated a price increase on June 4th, where the value rose from $7.10 to $7.40, marking a 4% increase.
This correlation suggests that transaction volumes could be a leading indicator of price movements.
Strategic Recommendations
Given the current technical setup and transactional trends, NEAR presents promising opportunities for traders and investors.
To capitalize on the bullish outlook:
Consider entering positions near the support levels provided by the 100 EMA and the 200 EMA on the 4H chart. These levels have consistently acted as strong support, indicating active buyer defense.
To manage risk, set stop-loss orders below daily EMAs. This ensures that positions are protected in case of unexpected downside movements.
Read More: Near Protocol (NEAR) Price Prediction for 2024
As long as NEAR remains above the Ichimoku Cloud on the daily chart, maintain a bullish stance. The cloud acts as a dynamic support zone, reinforcing the overall upward trend.
Pay attention to spikes in daily transaction volume, as it can be a precursor to price movements. Significant transaction peaks have previously anticipated price increases.
Disclaimer
In line with the Trust Project guidelines, this price analysis article is for informational purposes only and should not be considered financial or investment advice. BeInCrypto is committed to accurate, unbiased reporting, but market conditions are subject to change without notice. Always conduct your own research and consult with a professional before making any financial decisions. Please note that our Terms and Conditions, Privacy Policy, and Disclaimers have been updated.