



Many altcoins have struggled to maintain a bullish outlook for much of this cycle, resulting in only a few reaching new all-time highs (ATH).
However, as the third quarter of the year enters its final month, some altcoins are beginning to show signs of potentially surpassing their previous peaks. This analysis highlights the top four altcoins with the potential to achieve new ATHs and the reasoning behind this optimistic outlook.
Kaspa (KAS)
Kaspa (KAS), a cryptocurrency operating on the Proof-of-Work (PoW) consensus mechanism like Bitcoin (BTC), leads the list of altcoins with potential for new all-time highs. Currently trading at $0.16, KAS has been setting new ATHs since June, up until August 1.
Looking ahead to September, BeInCrypto anticipates that KAS will maintain its upward momentum, potentially surpassing $0.20. On the daily chart, KAS has been oscillating between $0.15 and $0.17 for the past 22 days, indicating that the $0.15 level has become a crucial support point for the cryptocurrency.

Additionally, the Money Flow Index (MFI) for KAS is currently at 24.38, indicating an oversold condition. The MFI measures the flow of liquidity in and out of an asset and helps determine whether a cryptocurrency is overbought or oversold. A reading of 80.00 or above suggests an overbought condition, while a reading of 20.00 or below indicates an oversold state, potentially signaling a buying opportunity.
KAS is approaching the oversold level, which suggests that a significant bounce could be on the horizon. Historical data shows that whenever KAS reaches an MFI reading similar to the current level, it often climbs to a new all-time high (ATH).
If this pattern holds, KAS could potentially reach $0.21 or higher in September. However, this prediction could be invalidated if the broader crypto market experiences another downturn, in which case KAS might drop to $0.14.
Binance Coin (BNB)
Ranked as the 4th most valuable cryptocurrency, Binance Coin (BNB) was the first major altcoin from the 2021 bull market to reach a new all-time high in June. In September, BNB could rally to another high, driven by the potential release of former Binance CEO Changpeng Zhao (CZ) from prison.
Currently priced at $540.26, BNB is 24.95% below its all-time high. On the weekly chart, BNB has formed a symmetrical triangle, a pattern that emerges when two trendlines — one sloping downward and the other upward — converge at a point.
A symmetrical triangle can signal either a bullish or bearish outcome, so it’s crucial to consider other indicators. In BNB’s case, BeInCrypto focuses on the 50-day Exponential Moving Average (EMA), which measures the trend direction over a specific period and could provide insight into the coin’s next move.
Read more: What Are Altcoins? A Guide to Alternative Cryptocurrencies
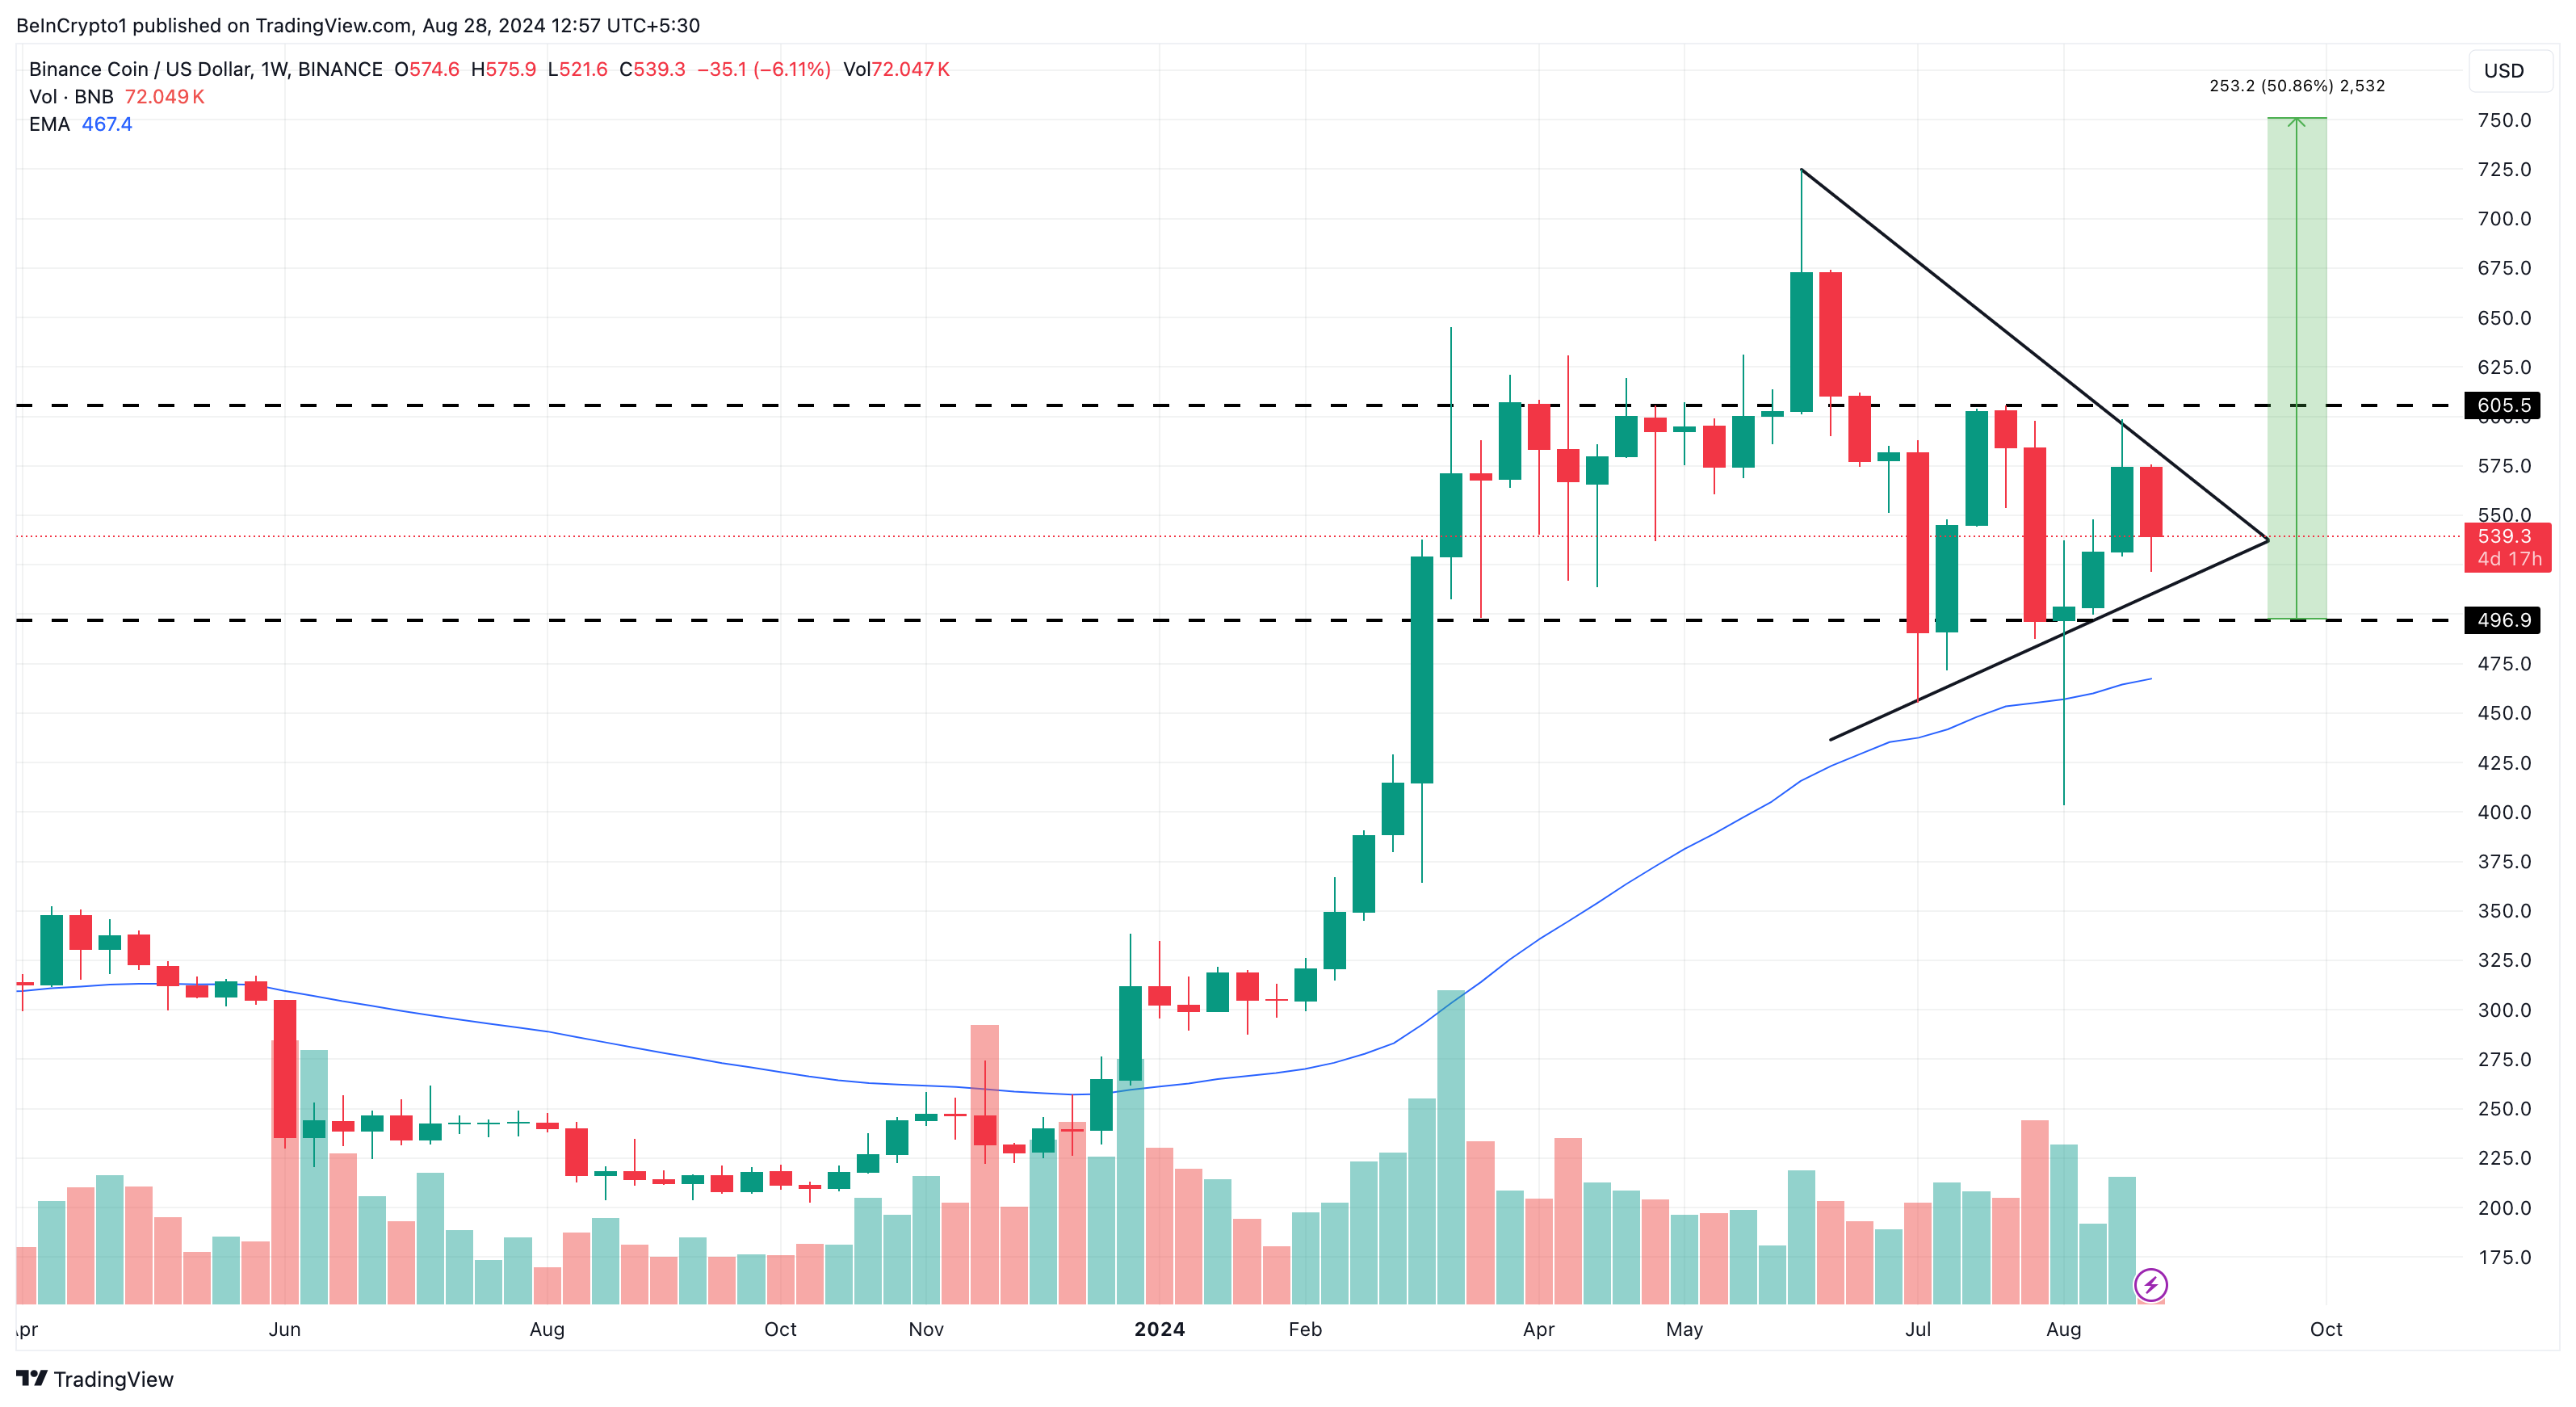
When the price of a cryptocurrency trades above its 50-day Exponential Moving Average (EMA), the trend is bullish; if it trades below, the trend is bearish. Despite BNB’s recent decline, it currently trades above the 50 EMA (blue), which could support the possibility of a new all-time high (ATH).
If buying pressure for BNB increases in September, it might once again outperform other top 10 altcoins and potentially reach a new ATH, possibly around $750. However, this outcome could be jeopardized if CZ’s release is delayed or if market interest in BNB wanes.
Brett (BRETT)
Regarded as “PEPE’s best friend” but built on the Base Layer-2 network, BRETT is part of the altcoins that could hit a new ATH in September. The meme coin currently trades at $0.081 and hit its ATH of $0.19 in June.
On the 4-hour chart, BRETT has formed an ascending triangle, a technical pattern that tends to be bullish. An ascending triangle arises from the convergence of a horizontal trendline and a rising one drawn along swing lows and highs.
As prices fluctuate along these highs and lows, cryptocurrencies often encounter resistance, as BRETT did with its drop from $0.10 to $0.081. However, this reversal might be temporary, suggesting that a significant rally could be imminent, potentially pushing the token toward $0.20.
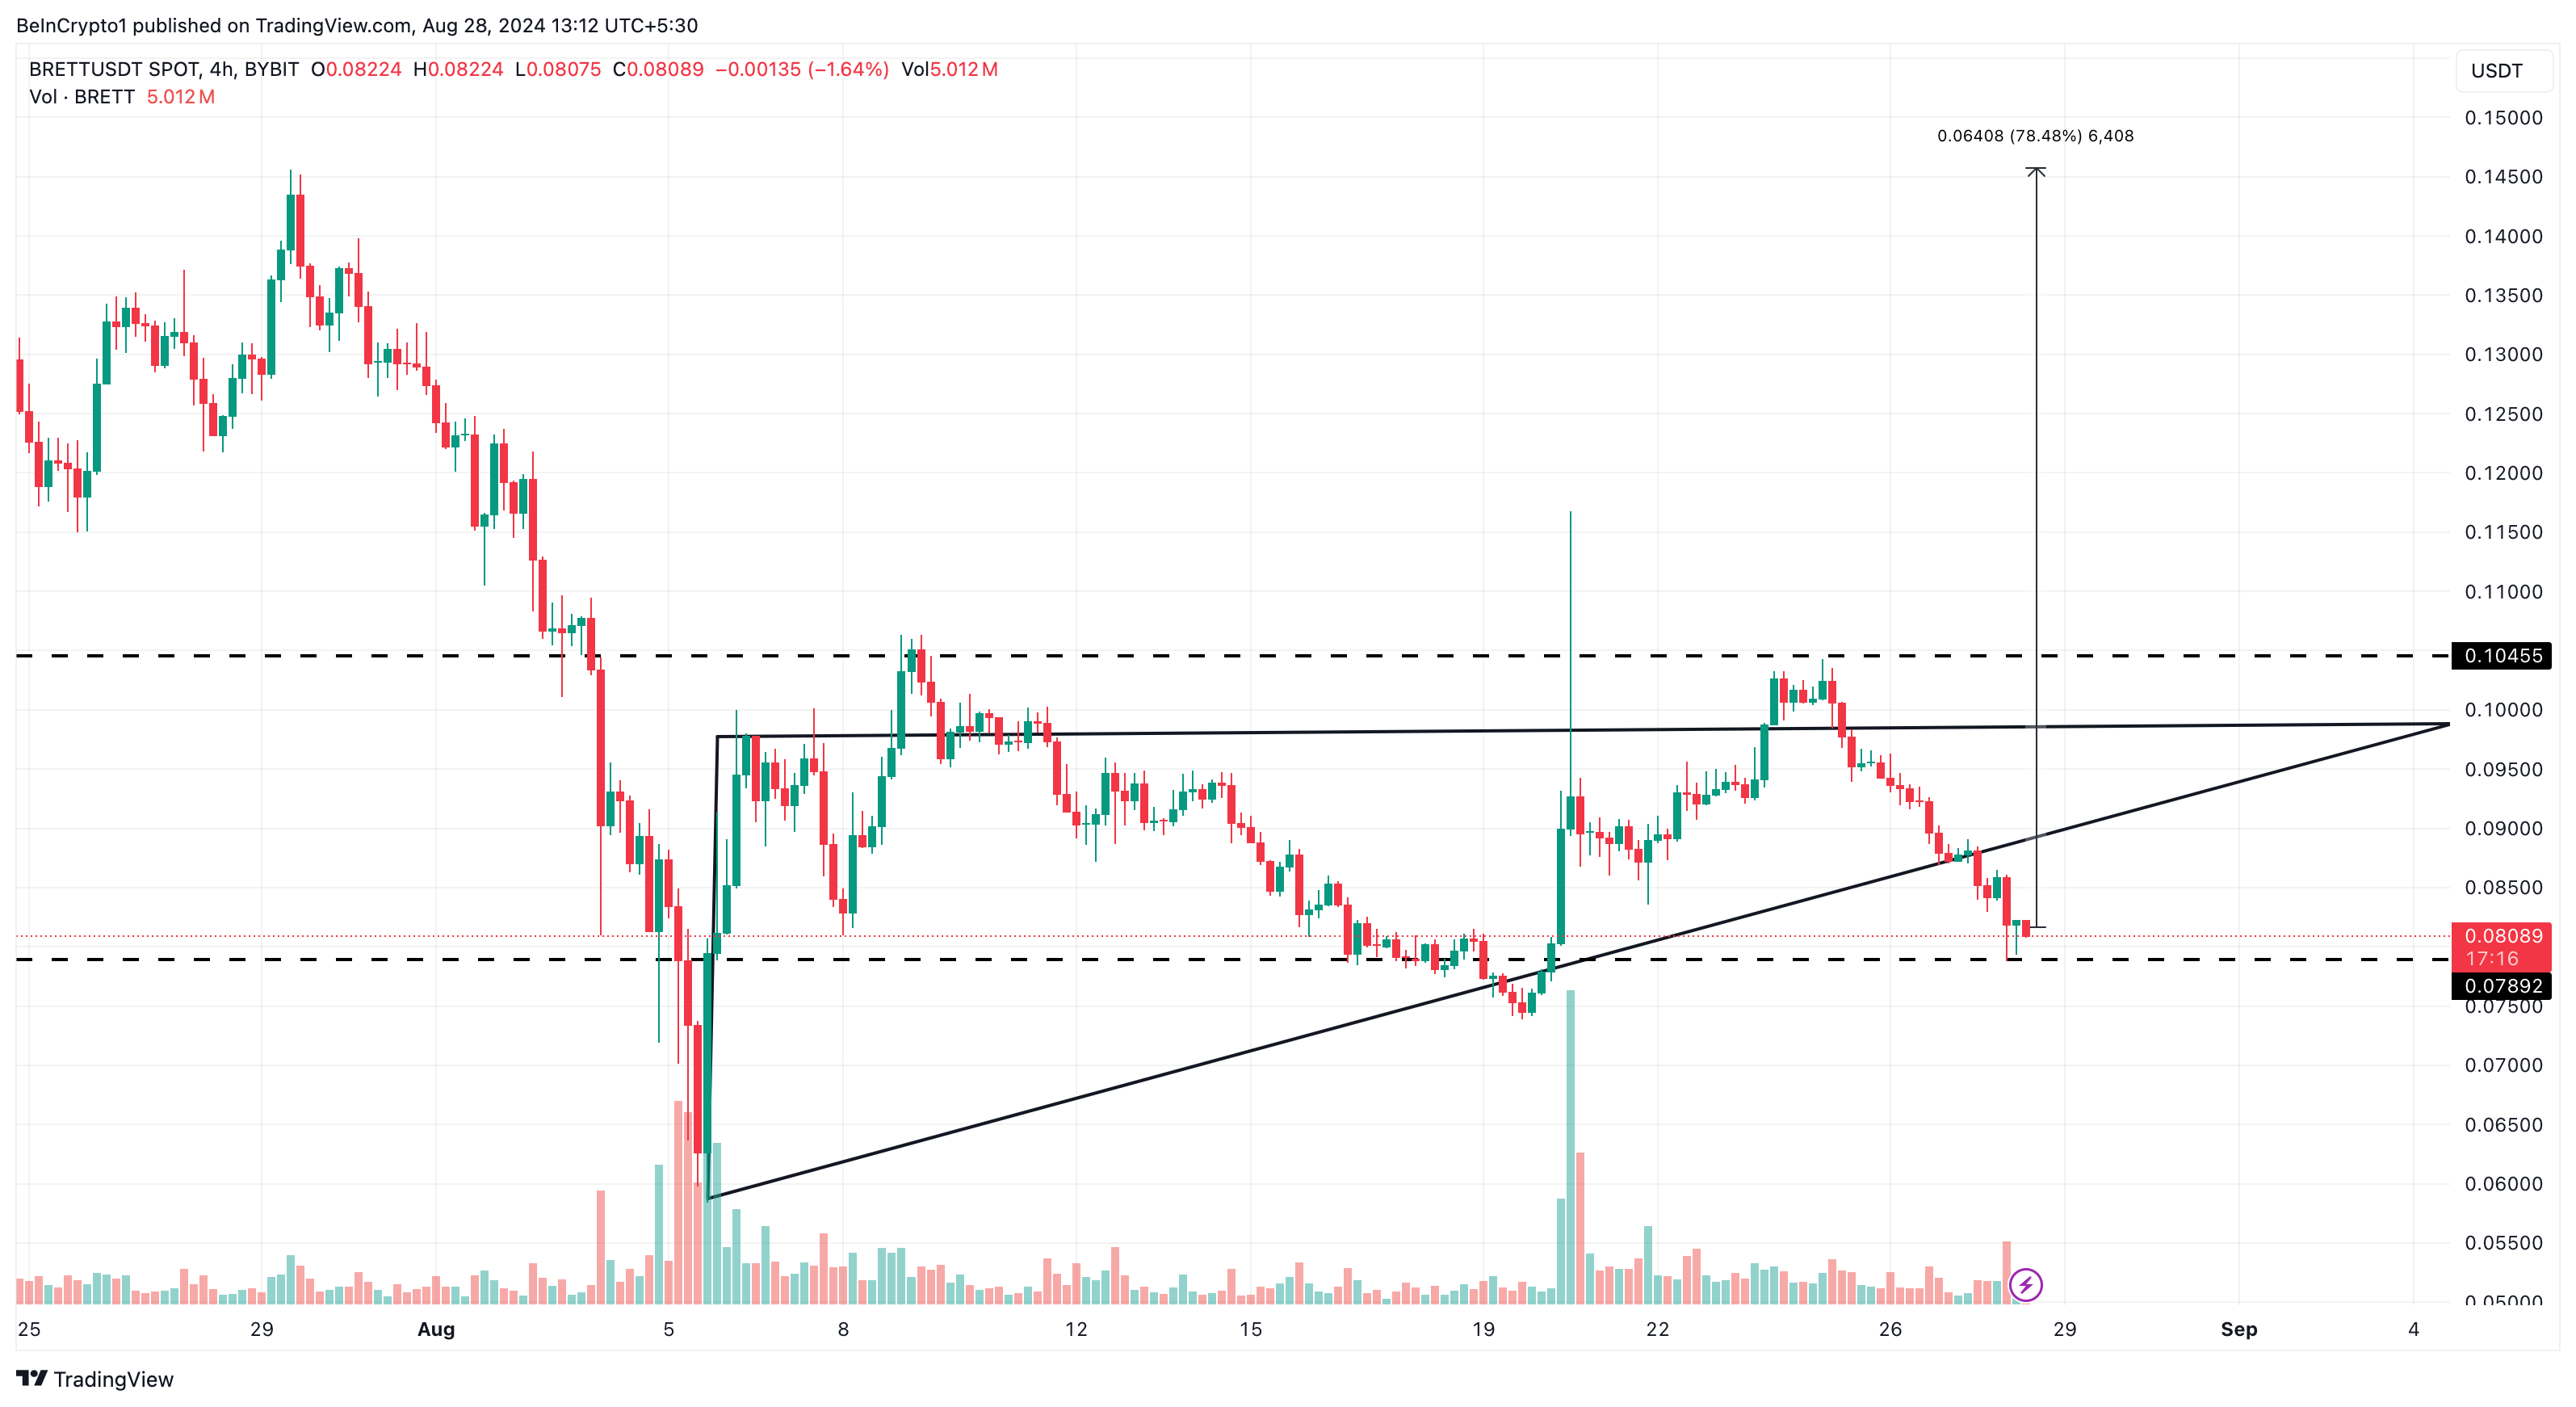
However, if BRETT does not experience significant accumulation in September, this bullish forecast could be nullified. In that scenario, the price might drop to $0.079.
Mantra (OM)
Mantra’s (OM) position as one of the top Real World Assets (RWA) altcoins is a key reason it makes this list. OM’s all-time high of $1.42 happened on July 22, but it has since dropped 37% from that height.
From a technical standpoint, OM has formed a falling wedge pattern on the daily chart. This pattern is characterized by two descending trendlines that connect the asset’s highs and lows. Typically, traders consider a falling wedge bullish because the narrowing lines suggest that sellers might be losing momentum.
If buyers take advantage of this potential seller exhaustion, a significant rally could ensue. For OM, a breakthrough of the 38.2% Fibonacci level could signal the start of a surge toward a new all-time high. Still, the 61.8% golden ratio at $1.15 might pose resistance to the price.
Read more: How to Invest in Real-World Crypto Assets (RWA)?
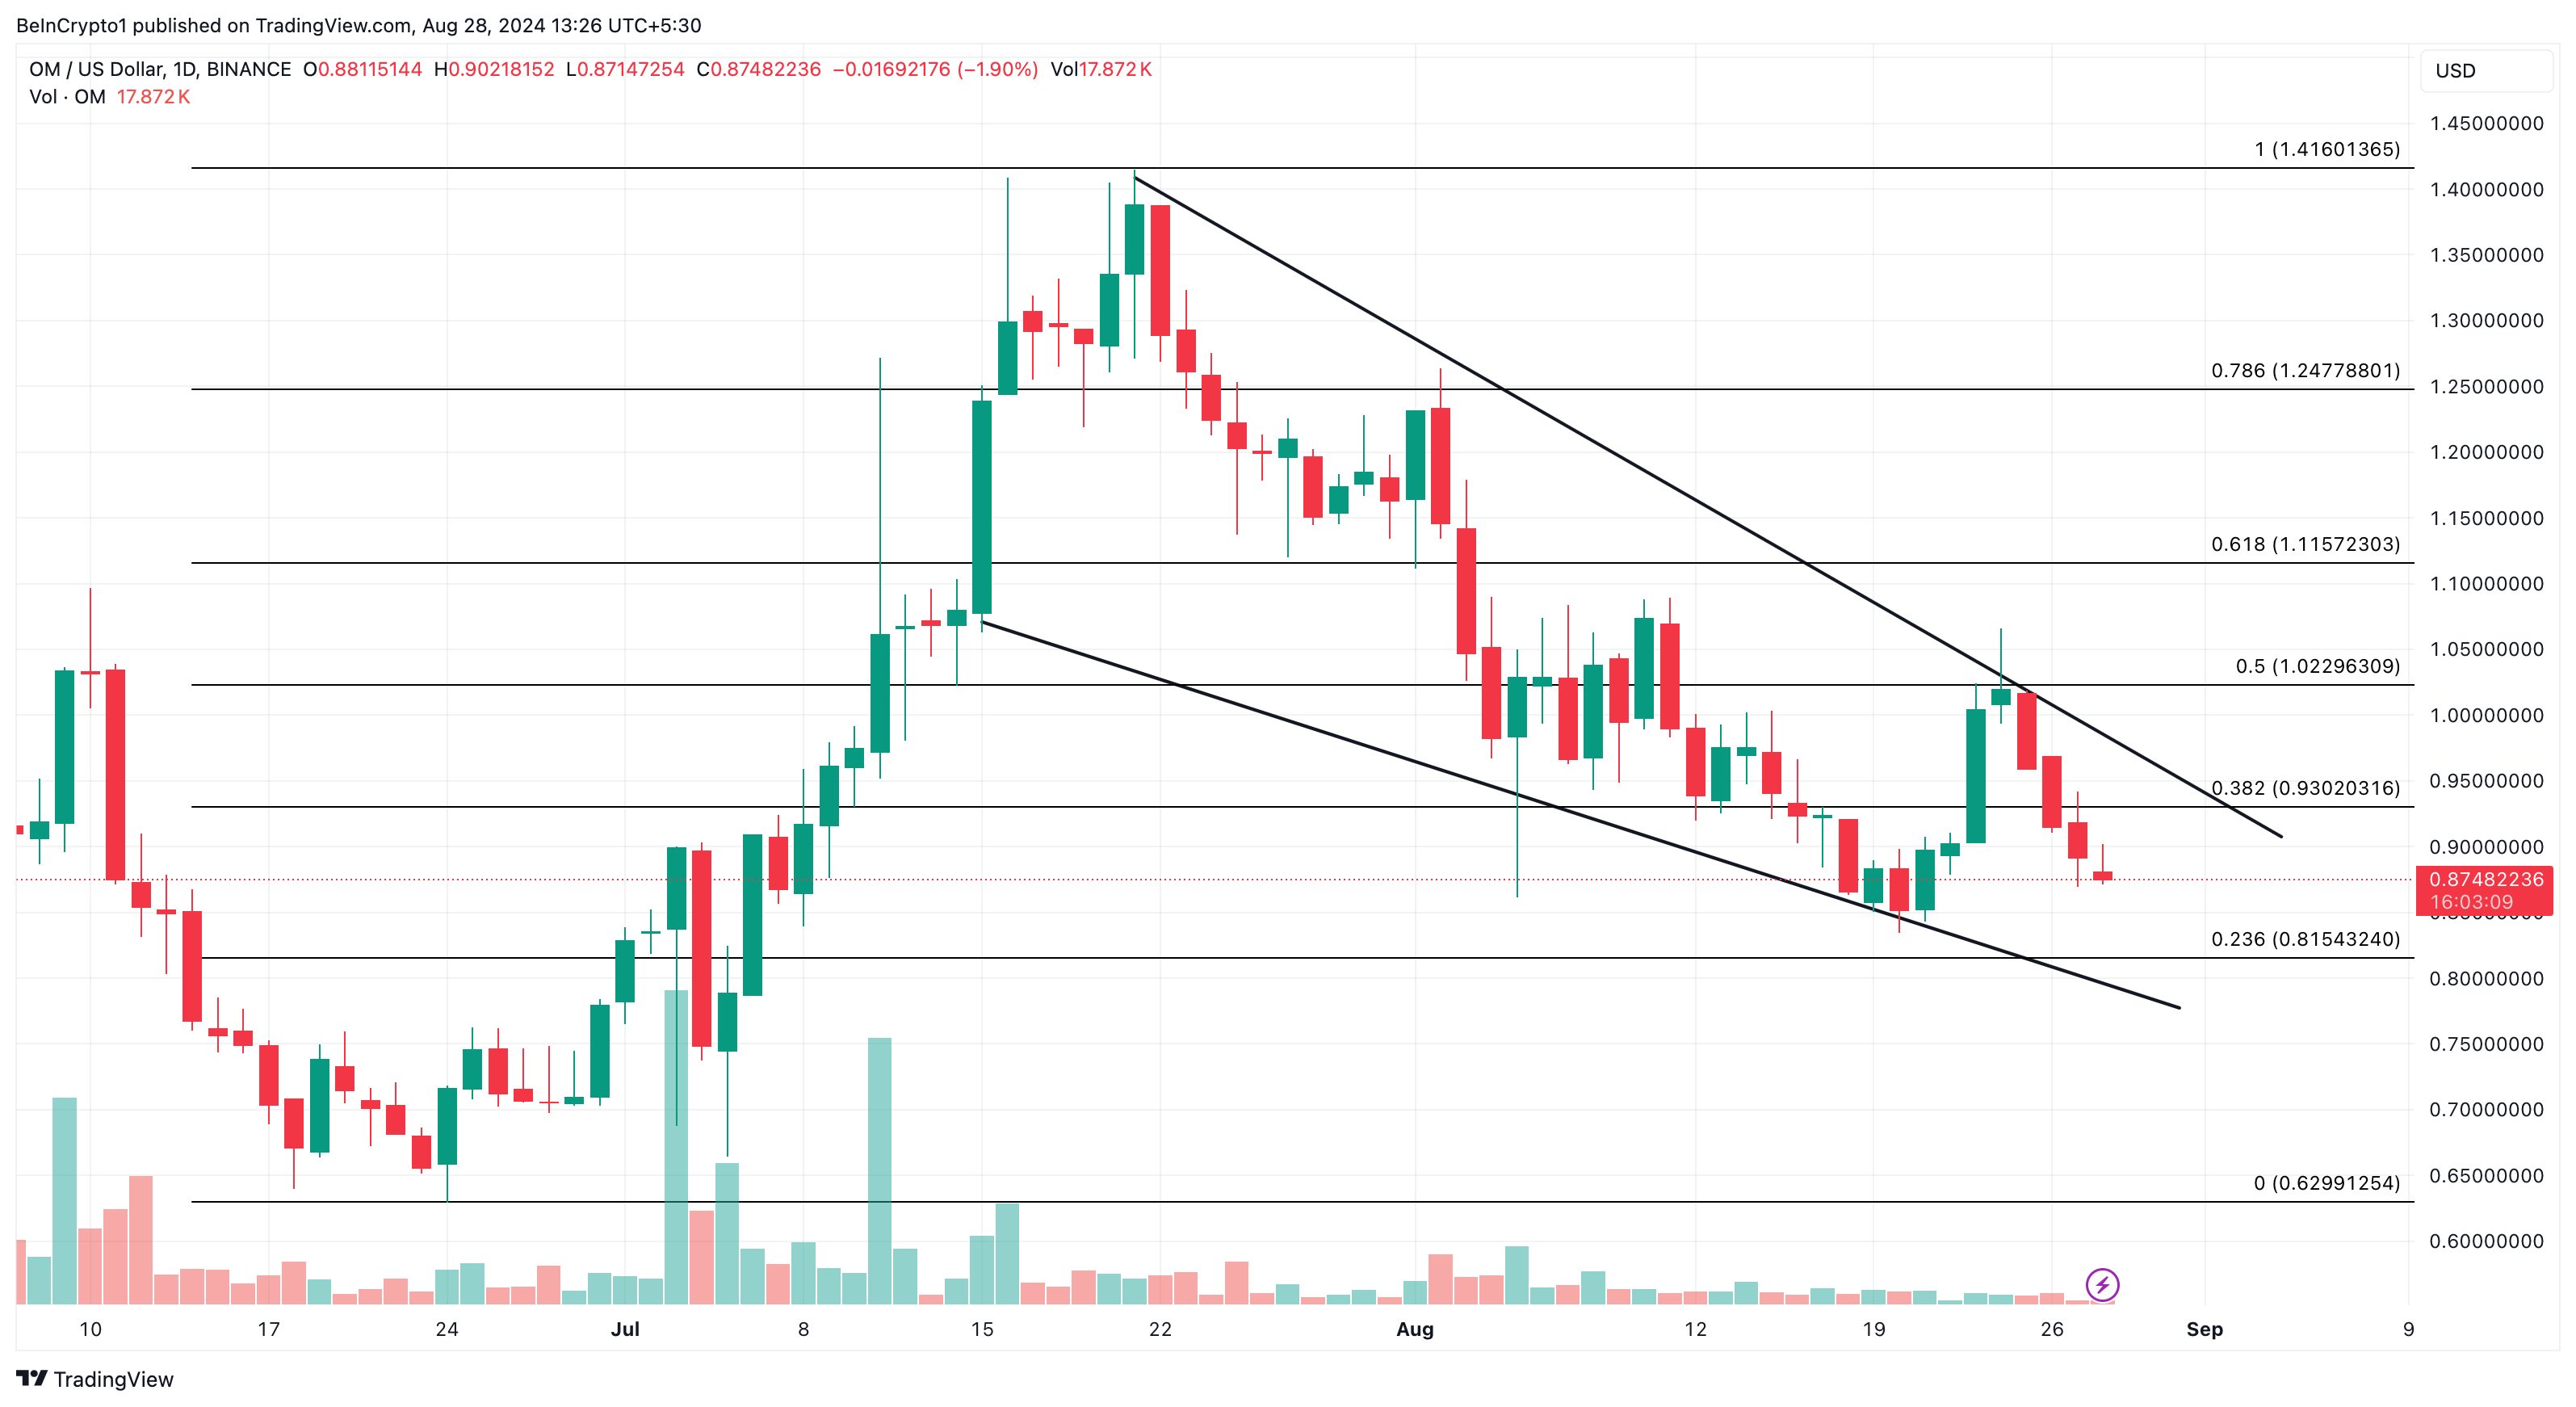
If OM breaks past the $1.15 resistance level, its price could potentially surpass $1.42 in September, making it one of the altcoins to hit a new all-time high (ATH). However, the bullish scenario could be invalidated if the token drops below the falling wedge’s lowest point again. If that occurs, the price might tumble to $0.62.
Disclaimer
In line with the Trust Project guidelines, this price analysis article is for informational purposes only and should not be considered financial or investment advice. BeInCrypto is committed to accurate, unbiased reporting, but market conditions are subject to change without notice. Always conduct your own research and consult with a professional before making any financial decisions. Please note that our Terms and Conditions, Privacy Policy, and Disclaimers have been updated.